Solar Potential Map
Solar Potential Maps are interactive maps that show how suitable each building in a city is for generating solar energy. Such cadastral works benefit everyone: They serve as a generally understandable orientation aid and have an incentive effect for the expansion of solar energy use among owners.
Advantages
All advantages at a glance
Professional analysis
Long-term partnership
Comprehensible visualizations
Individual configuration
Comprehensive profitability calculator
Your municipality future-oriented and environmentally conscious
Process
How does the solar potential register work?
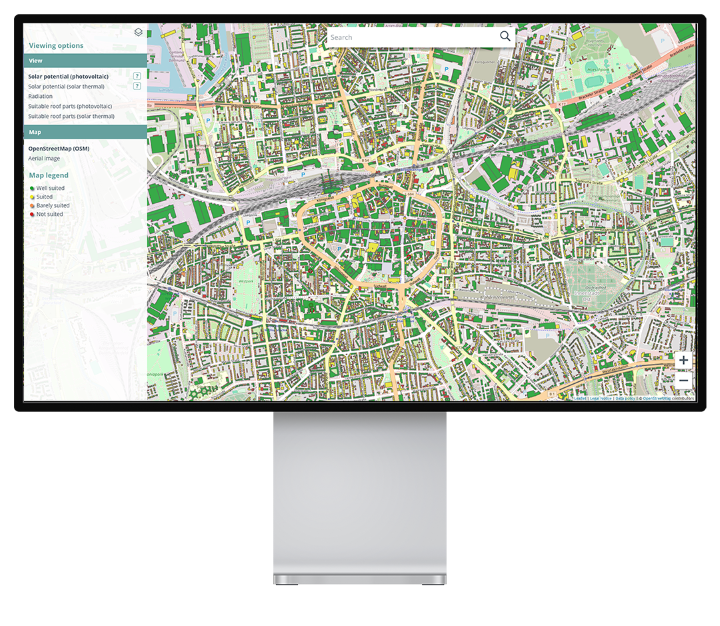
Interactive map
- Illustration of the suitability of buildings for the use of solar energy in an urban area
- Suitability of the roof area for photovoltaics and solar thermal energy is shown in different color-coded suitability levels
- The usable solar irradiation on the roof surfaces is displayed
- Detailed representation of the roof sections suitable for the installation of the systems
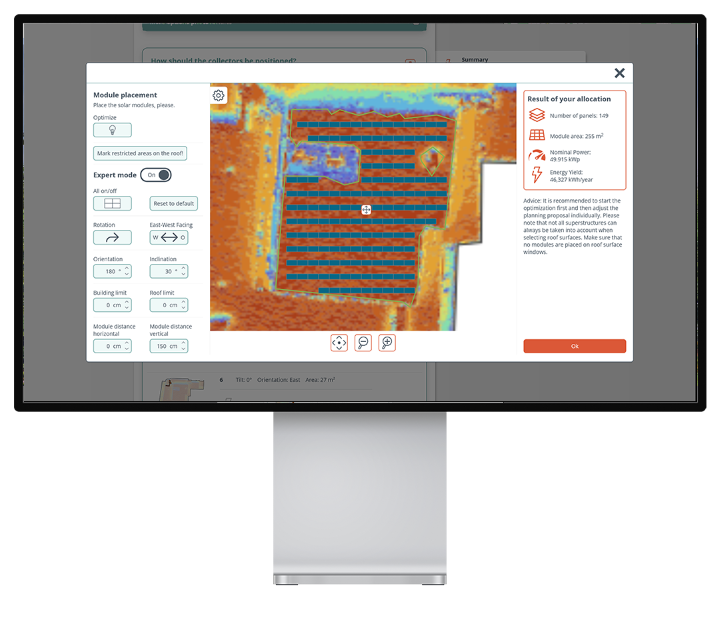
Module placer
- Modules can be placed on a roof surface and the system can therefore be adapted to your own needs and requirements
- Individual adjustment of the size dimensions and performance parameters as well as alignment of the planned system
- Good basis for detailed advice from a craftsman’s business
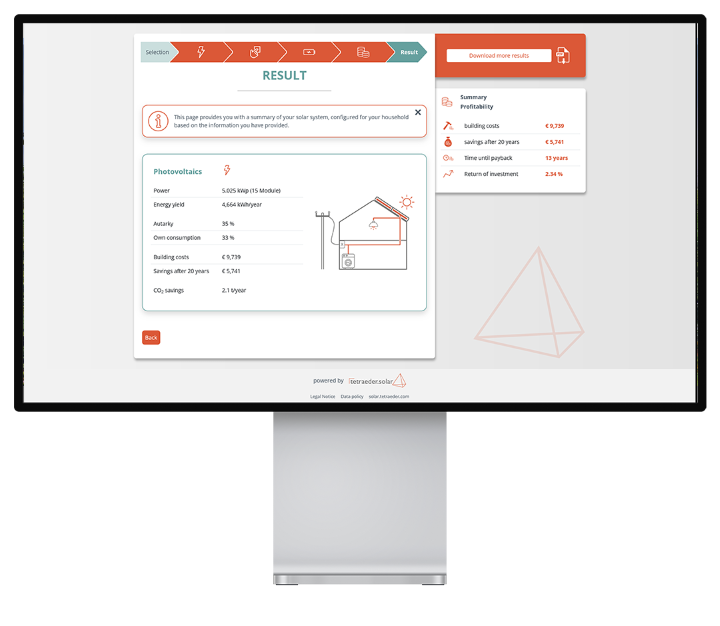
Profitability calculator
- Detailed statements on the economic efficiency of the system
- Calculation of independence, amortization and return on investment
- Precise results thanks to the inclusion of essential calculation parameters
- Constant adjustment of the framework conditions (electricity price, changed remuneration rates)
The technology
How the Solar Potential Map works
Solar Potential Mapss are based on three-dimensional surface models. Standard elevation data from laser scanning or aerial image data can be automatically converted into a 3D model using software specially developed for this purpose by tetraeder.solar and then processed together with the data from the real estate maps (ALK/ALKIS). Depending on the federal state, the laser scan data can be used free of charge or for a small fee.
The Solar Potential Map is calculated using lease scan data and matching data.
In combination with building perimeters, a 3D model is calculated in which roof surfaces are recognized.
The 3D model is used to simulate the irradiation curve, shadow effect and solar radiation received.
Do you have questions about the product?
Account Manager
FAQ
Frequently asked questions
A Solar Potential Map is created on the basis of laser scan data obtained by flying over an area. Roof surfaces are recognised and the solar radiation and shading are calculated. The actual energy yield depends on the efficiency of the solar modules.
Yes, as the cadastre has to be hosted and regular updates are made to the system, monthly hosting maintenance fees are incurred. These vary depending on the size of the calculated area.
The German data centres of Hetzner Online GmbH, which are powered by 100 percent hydropower (https://www.hetzner.com/de/unternehmen/umweltschutz/), are used for the server infrastructure.
Yes, we offer the so-called solar roof exchange. You can see an example here: https://www.solare-stadt.de/staedteregion-aachen/solardachboerse. If you are interested in this solution, please contact us.
The informative value of the solar potential register depends on the quality of the laser scan data. The better the data, the more accurately roof structures are taken into account. Buildings with insufficient data are labelled and minor deviations from the actual roof structure are possible.
Yes, the solar potential register can also be purchased without using the portal. We offer the option of integrating it into your own website via an IFrame.
Do you have any further questions?
Our products
Discover our other products
Contact us
Get to know us!
Do you have any questions about our products or would you like to find out more about the company? Please feel free to contact us!